
 Solar for home
 Solar for business
 Battery storage
 EV charging
 Solar panel calculator

 Fit Care
 Installation maintenance
 Panel cleaning
 case studies
 customer reviews
 Helpful information




The short answer
For UK homeowners who plan to stay put for 10+ years, a solar and battery system is a better investment than a high-interest savings account. In our worked example, an £8,500 system in a home using 3,500 kWh a year returns roughly 10.8% a year, tax-free at today's electricity prices, and about 13% if the forecast January price rise arrives. The best savings accounts pay about 4.5%, taxable above your allowance. Over 25 years, that turns £8,500 into about £49,000 with solar versus £25,500 in savings.
Savings aren't a bad choice. They're the right home for money you might need soon. But for long-term money, solar wins on return, tax treatment and protection against rising energy prices.
Key takeaways
- A system of 10 x 490W panels (4.9kWp) with a battery costs about £8,500 installed.
- At today's price cap, it pays for itself in about 8.7 years in a 3,500 kWh home. If the forecast January 2027 price rise arrives, that falls to about 7.8 years.
- The modelled return is about 11-12.5% a year, and it is tax-free. Savings interest is taxable above your allowance.
- Solar rises with electricity prices. Savings rates only stay flat or fall.
- Solar overtakes a savings account after about 13 years at today's prices, or about 10 years on the January forecast.
- Payback can be as short as 6 years for high-use homes on smart tariffs, but that is not the typical result.
Why savings look better than they are
Savings rates are strong by recent standards, and it's worth being fair about that. As of late September 2026, the highest UK rates range from 4.75% to 8.00% AER across easy access, notice, fixed and regular saver accounts. But look closely at how those rates are built:
- The highest rates are usually regular savers with monthly deposit caps, so it applies to small sums.
- Top easy-access rates often include bonuses that expire after 6-12 months.
- Competitive rates on larger balances sit nearer 4.3-4.55%, and top fixed bonds reach about 5.34% over five years.
Then four problems eat into that return:
- Rates are outside your control. Bonuses expire, and providers cut rates when the Bank of England does. A 4.5% account today could pay 3% in two years.
- Interest is taxable above your Personal Savings Allowance (£1,000 for basic-rate taxpayers, £500 for higher-rate, £0 for additional-rate), unless it's held in an ISA.
- Inflation quietly erodes it. If inflation is 3%, a 4.5% rate is a real return of about 1.5%.
- You end with cash and nothing else. The interest is all you get.
Why solar is a stronger engine for your money
Solar doesn't pay interest. It removes a cost you'd otherwise pay, and that gives it advantages savings can't match.
1. It saves money at the price you would have paid
Every kWh you generate and use is one you don't buy. Electricity is currently capped at 26.32p per kWh from 1 October to 31 December 2026. Saving a unit of electricity beats earning interest on cash, because the saving is tax-free.
2. It's linked to the thing you're trying to beat
If electricity prices rise, your saving rises with them. A savings rate can only stay flat or fall. Forecasters currently expect the price cap to rise again in January 2027 (more on that below), and 5% VAT returns to electricity in April 2027 unless the government extends the current 0% rate.
3. It works in several ways at once
A complete system cuts the power you buy during the day and stores surplus for the evening. It can also charge cheaply overnight on a time-of-use tariff, and it earns Smart Export Guarantee (SEG) payments for what you send to the grid.
4. You keep an asset
After 25 years, savings leave you with a balance. Solar leaves you with the accumulated savings and a system that may still be generating, plus a more efficient home that many buyers will value.
What does a complete solar system cost in 2026?
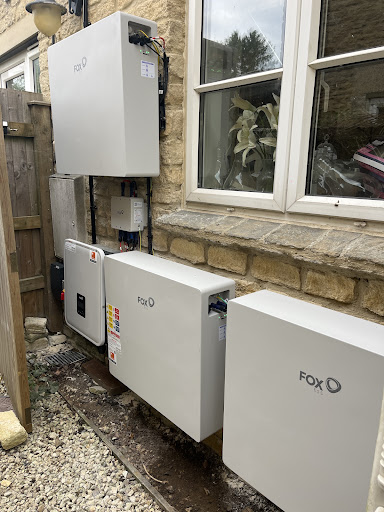
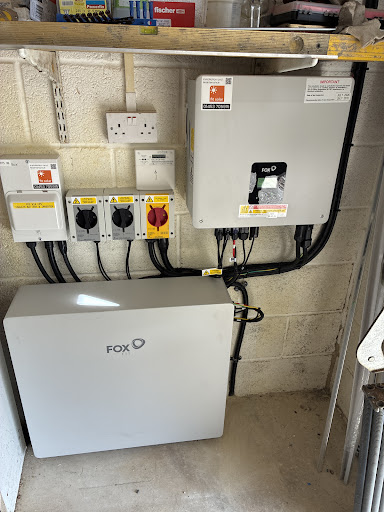
A system with ten panels (4.9kWp) with a battery costs approximately £8,500 fully installed. Installers price bundles differently, so get three quotes from MCS-certified installers and check what's included: scaffolding, monitoring, warranties and export setup. The 0% VAT rate is due to rise on 31st March 2027 unless government extends this, so timing matters.
How we calculated the return: the full working
We build the return from the bottom up: how much electricity a home uses, how much of it the system replaces, and what the surplus earns when sold back to the grid.
Assumptions
- Household use: 3,500 kWh a year. Ofgem's benchmark for a typical household is lower, at 2,500 kWh, so if you use less, expect a longer payback (see below).
- System output: 4.9kWp x 850 kWh per kWp = 4,165 kWh a year.
- Share of your demand met by solar: 80%. With a battery a well-matched home can get higher, but 100% is the best case, so we use 80% as the lead example.
- Electricity price avoided: 26.32p per kWh (the price cap from 1 October to 31 December 2026).
- Export rate (SEG): 12p per kWh. Rates range from about 3p to 25p depending on tariff and supplier, and the average tariff not tied to an installer pays far less than tied ones, so shop around.
- Price growth and degradation: electricity prices rise 3% a year, and panel output falls 0.5% a year.
- Replacement allowance: £1,500 for an inverter or battery replacement in year 12.
- Savings comparison: 4.5% held flat for 25 years, before tax. Solar savings are reinvested at the same 4.5% so the comparison is like for like.
Step by step (3,500 kWh home, 80% met by solar, today's price)
- Electricity you don't pay for: 3,500 kWh x 80% = 2,800 kWh
- Value of that: 2,800 kWh x £0.2632 = £737
- Surplus exported: 4,165 - 2,800 = 1,365 kWh
- Export income: 1,365 kWh x £0.12 = £164
- Annual benefit: £737 + £164 = £901
- Simple payback: £8,500 ÷ £901 = 9.4 years. Allowing for rising prices, about 8.7 years.
The ROI comparison: £8,500 in solar vs £8,500 in savings
| Savings account | Solar and battery system | |
|---|---|---|
| Upfront outlay | £8,500 | £8,500 |
| Year-1 return | £383 (4.5%), taxable | £901 (10.6%), tax-free |
| Payback | n/a | About 8.7 years |
| Overall annual return (IRR) | 4.5% (about 3.6% if your savings allowance is already used) | About 10.8% |
| Overtakes savings at | n/a | About year 13 |
| Value after 25 years | About £25,500 | About £46,700 |
The savings comparison is generous to savings. It assumes a 4.5% rate holds for 25 years and ignores tax. If the rate falls to 3%, the same £8,500 grows to about £17,800 instead.
£8,500 in solar vs £8,500 in savings: value over 25 years
A 4.9kWp solar and battery system in a 3,500 kWh home, against a savings account paying 4.5% a year.
- Solar system
- Savings account at 4.5%
Illustrative, not a forecast. Both start from the same £8,500: the savings line begins at £8,500 because that money stays in the bank, while the solar line begins at £0 because the money has been spent on the system. Solar line: the bill savings and export income from the system, reinvested at 4.5%, after a £1,500 inverter and battery replacement in year 12. It excludes any remaining value of the system itself. Savings line: £8,500 at 4.5% held flat, before tax. Assumes 80% of demand met by solar, 12p per kWh export, 3% a year electricity price growth and 0.5% a year panel degradation. Values rounded to the nearest £100. Energy price scenarios are forecasts and may change.
View the data as a table
| Year | Solar system | Savings account | Difference |
|---|
How the result changes with how much of your demand solar meets
| Solar meets... | Annual benefit | Payback (with price growth) | Approx. annual return | Value after 25 years |
|---|---|---|---|---|
| 100% of demand (3,500 kWh) | £1,001 | About 7.9 years | About 12.5% | About £53,700 |
| 80% of demand (lead case) | £901 | About 8.7 years | About 10.8% | About £46,700 |
| 68% of demand | £841 | About 9.4 years | About 9.7% | About £42,400 |
If you use less electricity: at Ofgem's typical 2,500 kWh, the same system saves about £790 to £870 a year, which means a payback of roughly 9-10 years and a return of about 9-10%. That still beats savings, but by a smaller margin.
If your export rate is different: in the lead case, a low 4.5p export rate stretches payback to about 9.6 years, and a 16p rate shortens it to about 8.3 years.
What the forecast energy price rise does to the numbers
Only the October to December 2026 price cap is confirmed. Energy consultancy Cornwall Insight currently forecasts that the cap will rise about 16% in January 2027, to roughly £1,999 a year for a typical household. Its figures imply an electricity unit rate of about 30.3p per kWh, compared with 26.32p now. Other forecasts differ, and Ofgem confirms the January to March cap by 25 November 2026.
The zero rate of VAT on electricity is also due to end on 31 March 2027. Unless it is extended, 5% VAT returns from April 2027, which would take a 30.28p rate to about 31.79p. Here is the lead case under each price:
| Today's cap | Jan 2027 forecast | Jan forecast + VAT returns | |
|---|---|---|---|
| Price per kWh | 26.32p | 30.28p | 31.79p |
| Value of 2,800 kWh self-used | £737 | £848 | £890 |
| Export income (1,365 kWh at 12p) | £164 | £164 | £164 |
| Annual benefit | £901 | £1,012 | £1,054 |
| Payback (with price growth) | About 8.7 years | About 7.8 years | About 7.5 years |
| Approx. annual return | About 10.8% | About 12.5% | About 13.1% |
| Value after 25 years | About £46,700 | About £53,000 | About £55,000 |
| Overtakes savings at | About year 13 | About year 10 | About year 10 |
Two cautions. First, the January figure is a forecast. Wholesale prices can move before it is confirmed, and the cap resets every quarter, so prices could just as easily settle back. If they do, use the "today's cap" column. Second, if prices rise once and then stay flat, with no further increases, the lead-case payback at 30.28p is the simple 8.4 years (£8,500 ÷ £1,012).
Can solar really pay back in 6 years?
Sometimes, but not typically. On £8,500, a 6-year payback needs about £1,330 a year of benefit. Using every unit yourself and exporting the rest reaches about £1,140 at the January forecast price. The gap can be closed by a time-of-use tariff, where the battery charges cheaply and discharges or exports at peak times, which some sources put at £300-£450 a year for a 5kWh battery. Part of that overlaps with the savings already counted, so treat it as a best case. Six years is realistic for a well-matched, high-use home on a smart tariff, and 8-9 years is a fairer typical figure.
How solar compares with other investments
| Investment | Typical return (long-run / current) | Risk | Liquidity | Tax treatment |
|---|---|---|---|---|
| Easy-access savings | About 4-5% now | Very low (FSCS-protected up to £120,000) | High | Interest taxable above allowance |
| Fixed-rate bonds | Up to about 5.3% | Very low | Locked in | Taxable |
| Cash ISA | About 4.5-5% | Very low | Medium to high | Tax-free |
| Government bonds (gilts) | Broadly comparable to savings rates | Low to medium (price risk) | High | Gains generally CGT-exempt |
| Global equities | About 7-10% nominal historically | High: falls of 30-50% happen | High | ISA and pension wrappers help |
| Buy-to-let property | About 5-7% rental yield plus growth, before costs | Medium to high | Very low | Heavily taxed |
| Gold | Mixed; no income | Medium to high | High | CGT-exempt in some forms |
| Home solar and battery system | About 9-13% (modelled, depends on usage) | Low to medium | Low | Savings not taxed |
Solar competes with the stock market on return without the stock market's swings, though its figure depends heavily on how much electricity you use. It beats cash on return, tax and inflation protection. And unlike buy-to-let, it has no tenants, no stamp duty surcharge and no rental income tax.
Five reasons the case for solar keeps getting stronger
- Energy prices have been volatile. A system covers a large share of your future power at a known cost.
- Electrification is growing. If you add an EV or heat pump, your usage rises, and so does the value of every kWh you generate.
- Savings rates are cyclical. Today's rates are attractive, but they won't last forever.
- Installation currently carries 0% VAT. The rate returns to 5% on 1 April 2027 unless the government extends it, which would add about £425 to an £8,500 system.
- It's simple. There's no market timing, no switching accounts every 12 months, and no bonus rates to track.
Who benefits most from solar?
Solar is likely to be a strong investment if:
- You own your home and plan to stay 10+ years
- You have a reasonably unshaded south, east or west-facing roof
- You use meaningful electricity, especially in the evening or with an EV or heat pump
- You already have 3-6 months of expenses saved
When savings are still the right call
An honest comparison includes the cases where solar isn't the right move:
- You may move within 5 years. You might not recoup the cost before selling.
- You need access to the cash. Solar is illiquid, so keep your emergency fund in an easy-access account.
- Your roof is heavily shaded or awkward, which lengthens payback.
- Your electricity use is low, so there's less to offset.
- Energy prices fall. The forecast rise is not guaranteed, and lower prices would lengthen payback.
- You don't have an emergency fund yet. Build that first.
Also remember that inverters and batteries typically need replacing once in a system's life, installer quality varies, and all projections here are estimates. That is why the model includes a replacement allowance, and why you should use an MCS-certified installer with strong warranties.
A sensible split: keep short-term money in savings, and treat solar as a long-term, inflation-linked holding.
How to check the numbers for your own home
- Find your annual electricity use (kWh) from your bill or smart meter.
- Get three MCS-certified quotes with expected annual generation and savings.
- Estimate the share of your use the system will cover. Ask installers for their modelled self-use figure.
- Value it: self-used kWh x your unit rate, plus exported kWh x your SEG rate.
- Work out your payback: total cost ÷ annual benefit.
- Compare it with the after-tax interest the same money would earn in savings, and remember that rates can fall.
Frequently Asked Questions
For homeowners staying 10+ years, yes. An £8,500 solar and battery system in a 3,500 kWh home can return roughly 10% a year tax-free at today's prices, against about 4.5% taxable from top savings accounts. The gap widens every year after the system has paid for itself.
Ten 490W panels (4.9kWp) with a battery cost about £8,500 installed in 2026. Prices vary by installer and roof, so compare at least three MCS-certified quotes and check what's included.
In our worked example, about 8.6 years at today's electricity price and about 7.7 years if the forecast January 2027 rise arrives. Lower-use homes take longer, at around 9-10 years, and high-use homes on smart tariffs can reach about 6 years.
A system costing £8,500 and saving about £900 in year one returns roughly 10% a year over 25 years, based on 3% annual electricity price growth. On the forecast January price it is about 12.5%. Homes using less electricity see roughly 9-10.5%.
Yes, because solar savings are worth more when electricity costs more. Cornwall Insight forecasts a 16% rise in the price cap in January 2027, but forecasts can change and Ofgem confirms the figure by 25 November 2026. If prices fall, the return falls too.
Equities have historically averaged similar or higher returns, but with large swings. Solar offers lower volatility and a return linked to your own energy bills. Many people hold both.
Bill savings aren't income, so they're not taxed. SEG payments from a normal domestic system are generally not taxed either, but check HMRC guidance or an adviser for your situation.
The Short Answer: Yes, With the Right System Solar panels can and do add value to residential properties in the UK. The evidence from both academic research and market analysis is increasingly clear: homes with solar PV systems sell for more, sell faster, and are becoming more desirable as energy costs remain elevated and buyers prioritise low running costs.
Conclusion
A savings account is a fine place for money you might need. But for long-term money, it can only offer a variable, taxable rate that inflation chips away at. A solar and battery system replaces a cost you'd otherwise pay every month, with savings that are tax-free, grow as energy prices rise, and keep coming for 25 years or more. For homeowners with a suitable roof and a long horizon, solar is the stronger investment, and the longer you hold it, the better it looks.
Sources
- Ofgem: energy price cap unit rates and standing charges
- Cornwall Insight: 16% price cap rise forecast in January
- Moneyfacts: best savings account rates
- Which?: best savings accounts
- Smart Export Guarantee overview, citing Ofgem year-5 data
- EnergyPlus: 2027 price cap forecasts and the April VAT change


